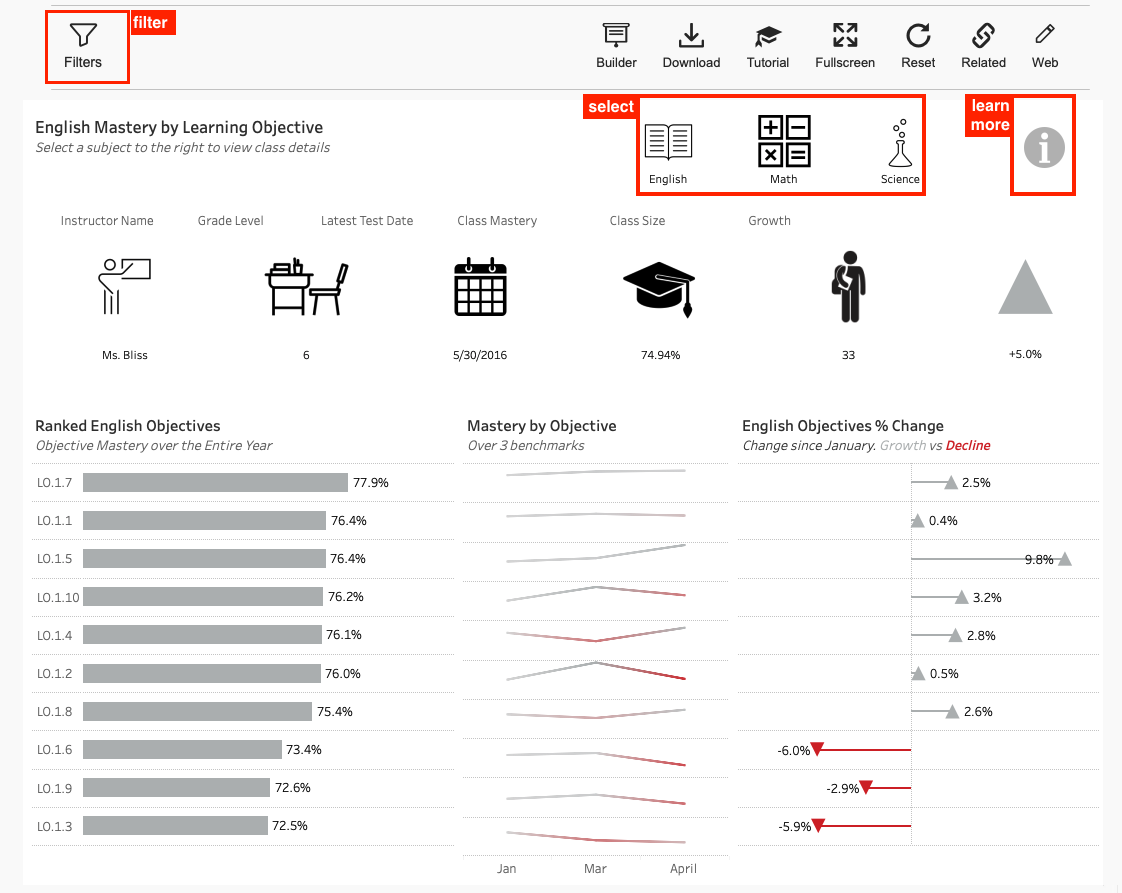
Select a content area from the icons at the top of the dashboard to filter. The summary statistics show key information for each class. The charts below show the top objectives the selected content, as well as objective mastery for each of the 3 months and the overall class growth or decline for each objective. Hover over the table for details on each student's growth.
